| state | division | element | year | jan | feb | mar | apr | may | jun | jul | aug | sep | oct | nov | dec | |
|---|---|---|---|---|---|---|---|---|---|---|---|---|---|---|---|---|
| 0 | 1 | 1 | 5 | 1895 | 0.11 | -0.81 | -0.56 | -0.72 | -0.85 | -0.99 | -0.90 | -1.13 | -1.69 | -1.72 | -2.04 | -2.12 |
| 1 | 1 | 1 | 5 | 1896 | -2.47 | -2.06 | -1.75 | -1.84 | -2.16 | -1.74 | -1.53 | -2.10 | -2.23 | -2.41 | -1.61 | -2.53 |
| 2 | 1 | 1 | 5 | 1897 | -2.45 | 0.05 | 1.48 | 1.98 | -0.51 | -1.02 | -1.39 | -1.50 | -2.49 | -3.02 | -3.23 | -2.63 |
| 3 | 1 | 1 | 5 | 1898 | -1.73 | -2.43 | -2.75 | -2.09 | -2.60 | -2.72 | -2.65 | -2.47 | -2.07 | -1.67 | -1.51 | -1.97 |
| 4 | 1 | 1 | 5 | 1899 | 0.15 | 0.46 | 0.96 | -0.24 | -0.89 | -1.51 | -1.57 | -2.10 | -2.66 | -2.85 | -3.31 | -2.88 |
Technical Write-up
Abstract
This project looks at how drought conditions relate to farm income across U.S. states using state data from 1949 until 2014. Drought severity is measured with the Palmer Drought Severity Index (PDSI), and farm income is measured using state-level income totals categorized by farming product. The analysis follows a consistent workflow to clean, combine, and analyze the data. When income is analyzed at the national level, the relationship with drought appears weak. After adjusting income within each state, a much clearer relationship appears. This shows that changes in drought conditions are linked to changes in farm income within states, even if this pattern is hidden in overall comparisons.
- Introduction
Studying how weather affects farm income is challenging because U.S. states differ widely from one another. Some states consistently earn much more farm income than others due to differences in crops, land use, and scale of production. When all states are analyzed together, these baseline differences can dominate smaller year-to-year changes.
The goal of this project is to determine whether drought conditions are related to changes in farm income once these baseline differences are removed. Rather than focusing on raw income levels, the analysis examines how income in a given year compares to a state’s typical income. This makes it easier to compare patterns across states and focus on changes rather than overall size.
- Data Sources 2.1 Climate Data (PDSI)
Monthly Palmer Drought Severity Index data were downloaded from NOAA. The raw data are provided as fixed-width text files, so the column locations must be specified manually in order to read them correctly. Each observation includes a state, year, month, and a PDSI value that reflects drought conditions.
2.2 Farm Income Data
Farm income data were collected from public U.S. agricultural economic sources. These data are reported at the state-by-year level and represent total farm income before any adjustments. The structure of these data matches the aggregated PDSI data, which allows the two datasets to be combined cleanly.
- Data Processing and Combination 3.1 Reading and Aggregating PDSI Data
The raw PDSI text files were read using a custom function designed for fixed-width data. This step converts the text files into tables that can be used in Python. Monthly PDSI values were then averaged within each state and year to create a single yearly drought value, referred to as yearly_avg.
3.2 Combining Climate and Income Data
The yearly PDSI data and farm income data were combined using state and year as matching keys. The result is a state-by-year dataset where each row represents one state in one year, with both drought and income information.
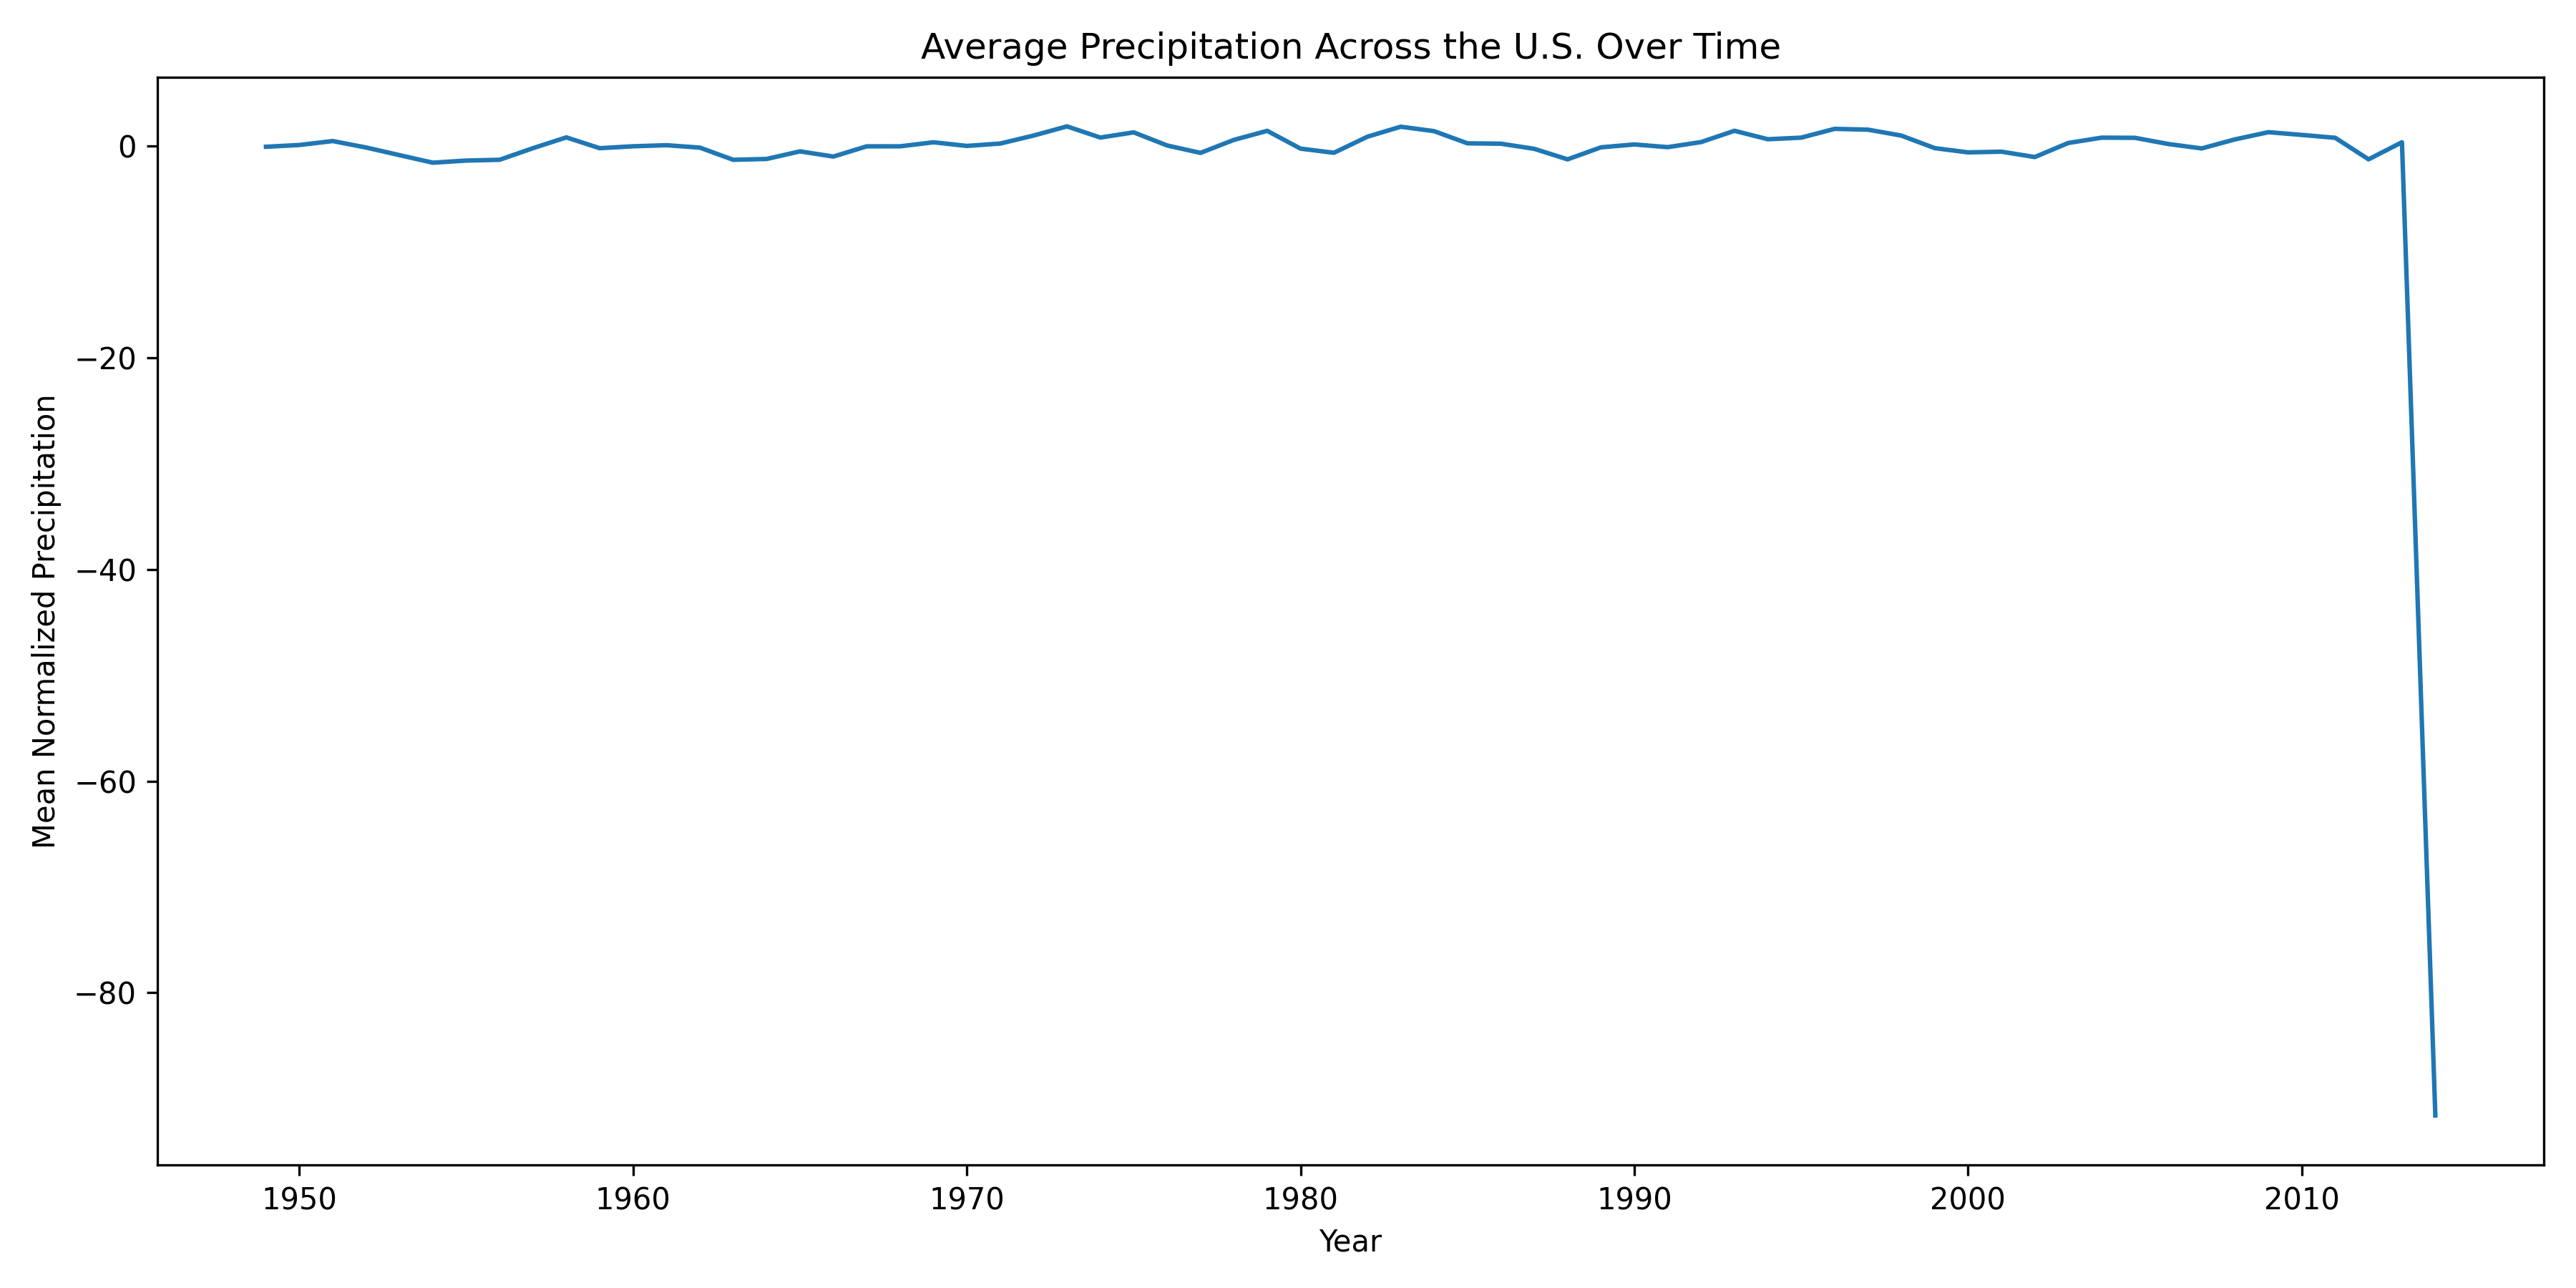
- Exploratory Analysis and Data Cleaning
Initial plots revealed a clear issue in the PDSI data for the year 2014. In that year, all states showed unusually low values that did not follow the patterns seen in nearby years. Because this behavior is most likely due to a data issue rather than actual drought conditions, these extreme values were removed before continuing the analysis.
Only values that were clearly unrealistic were filtered out. This helps prevent these points from having too much influence on correlations and fitted relationships.
- Methods 5.1 Correlation Analysis
The relationship between drought conditions and farm income was first explored using Pearson correlation values. Scatter plots were also used to visually examine the relationship and check for general patterns or unusual spread.
5.2 Adjusting Income Within States
To remove large income differences across states, farm income was adjusted within each state. For each state, the average income across all years was calculated and subtracted from each yearly value.
This shifts the focus away from absolute income levels and toward how much a given year is above or below a state’s typical income.
5.3 State-Level Plots
Scatter plots colored by state were used to see whether states behave differently. These plots make it easier to compare how income responds to drought across states while still showing the overall trend.
- Results 6.1 Results Using Unadjusted Income
When farm income is analyzed in its original form, the relationship with PDSI appears weak. The scatter plot shows a wide range of income values, largely driven by differences between states rather than changes over time.

6.2 Results Using Adjusted Income
After adjusting income within states, the relationship between PDSI and income becomes much clearer. The scatter plot is more tightly grouped, and the correlation increases substantially. This suggests that when drought conditions improve or worsen within a state, farm income tends to change in the same direction.
When points are colored by state, most states show similar upward trends, even though their average income levels differ. This suggests that drought affects farm income in a similar way across states, but around different baseline income levels.

- Python Package Implementation
All steps of the analysis are wrapped into a Python package so the workflow can be rerun easily. Each step, including reading data, averaging values, combining datasets, cleaning data issues, adjusting income, and creating plots, is handled by a separate function. This structure makes the code easier to follow and reuse.
The package follows standard Python project rules, including a pyproject.toml file that lists dependencies and build settings. The package can be installed and run in a clean environment without manual setup.
- Discussion
Once income differences across states are accounted for, drought severity shows a clear relationship with farm income. Analyses that ignore these differences may incorrectly suggest that drought has little effect. This project shows how relatively simple adjustments can change how results are interpreted.
- Limitations and Future Work
This analysis focuses on patterns and correlations rather than cause-and-effect claims. Future work could add regression models with state fixed effects, include delayed drought effects, or use more detailed income data.
- Conclusion
This project shows that drought conditions are closely related to changes in farm income within states. By adjusting income to remove baseline differences, the analysis reveals patterns that are hidden when all states are compared together. The workflow also provides a reusable setup for future studies of climate and agriculture.